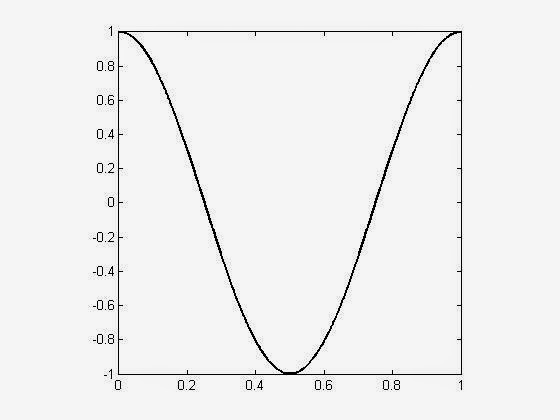
First, let's create sinusoidal function with the code below. It is important to set the free parameters of the sinusoidal functions: frequency, amplitude, and phase.
frequency = 1;%Set the frequency
phase = 90;%Set the phase in degrees that needs to be converted to radians
amplitude = 1;%Set the amplitude
x = 0:0.001:1;%x domain
wave = amplitude*sin((2*pi*frequency*x)+(deg2rad(phase)));
plot(x,wave,'k','Linewidth',2)
axis square
Fig 01. Graphical representation of the sinusoidal function set in the code above (frequency = 1; phase = 90 deg; amplitude = 1).
Now, I'll show how to use the sinusoidal function to modulate the spatial luminance to create sinusoidal gratings. The code below use introduces the functions meshigrid( ) and surf( ). The function meshgrid( ) are used to create a square matrix that will be used to be modulated by the third dimension, the spatial luminance. The surf( ) function is used to make three dimensional shaded surface plot.
%We set the same previous parameters
frequency = 1;
phase = 90;
amplitude = 1;
[X,Y]=meshgrid(0:0.001:1,0:0.001:1);
Z = amplitude*sin((2*3.1415*frequency.*X)+(phase));
surf(X,Y,Z)
shading interp
view(0,90)
colormap gray
axis off
axis square
Fig 02. Luminance spatial sinusoidal grating for the parameters of the code above (frequency = 1; phase = 90 deg; amplitude = 1). Look the luminance is following the profile of the plot in the Figure 01.
Now, try to change the parameters to visualize other several sinusoidal waveforms. Below, more examples of sinusoidal functions and its correspondent sinusoidal grating. To know better about meshgrid( ) and surf( ) functions read the MATLAB help.
frequency = 4, phase = 0; amplitude = 1 frequency = 10, phase = 270; amplitude = 1
Any doubt, contact me in givagosouza@gmail.com


Will you ever write again?
ReplyDeletei want to know how to simulate interference pattern of two beam(reference and any step like object beam) by changing frequency of reference in one beam
ReplyDelete